
- Home
- Track and Field (Athletics)
- Strength Training and Conditioning
- Sports and Activities
- Physiology of Sport and Exercise
- Health Care in Exercise and Sport
- Coaching and Officiating
- Monitoring Training and Performance in Athletes

Monitoring Training and Performance in Athletes
264 Pages
The use of athlete and team training and performance monitoring systems has grown due to technology advances. Practitioners who work with athletes from high school to elite levels in a range of sports use these systems to observe athlete data, including exercise intensity, athletic fitness, and body responses. Monitoring Training and Performance in Athletes is a compilation of evidence-based guidelines and best practices of athlete monitoring for practitioners, who are increasingly being asked to implement monitoring systems and to collect, analyze, and interpret data that ultimately result in training adjustments to optimize performance.
Author Mike McGuigan, an award-winning sport scientist, blends research-based concepts with practical application strategies of monitoring training and performance in athletes. The content highlights what can be monitored, such as body stress, biochemical markers, and hormonal response; discusses reliability of modern methods, such as wearable technology and questionnaires; and helps readers understand how to interpret data to modify training programs in real time. Readers will find guidelines, approaches, and solutions for challenges in athlete monitoring for individual and team sports as well as suggestions for integrating monitoring with coaching.
Numerous sidebars in the text provide real-world examples and application of the content to assist readers in understanding concepts and the cutting-edge, evidence-based research on athlete monitoring. Additionally, the full-color illustrations and photographs provide a visual interpretation of the information presented.
With broad international appeal, this text outlines the most pertinent evidence-based research concepts and studies on athlete monitoring. Strength and conditioning, athletic training, and personal training professionals who work with athletes and monitor training programs will find Monitoring Training and Performance in Athletes an invaluable guide in managing monitoring systems and making adjustments in training programs based on the data to help athletes and teams achieve peak performance.
Earn continuing education credits/units! A continuing education course and exam that uses this book is also available. It may be purchased separately or as part of a package that includes all the course materials and exam.
Chapter 1. Why Monitor Athletes?
Stress Response to a Training Session
Adaptation to a Training Program
Risk of Overreaching, Overtraining, Sickness, and Injury
Importance of Individualized Monitoring
Conclusion
Chapter 2. Research Tools for Athlete Monitoring
Basic Statistical Tools for Practitioners
Descriptive Statistics
Reliability
Validity
Meaningful Change
Correlation and Relationships
Presentation of Results
Qualitative Analysis
Conclusion
Chapter 3. Physiological Effects of Training Stress
General Adaptation Syndrome Model
Fitness-Fatigue Model
Stimulus-Fatigue-Recovery-Adaptation Model
Applications of the Models
Fatigue Continuum
Overreaching and Overtraining
Interdisciplinary and Multifactorial Approaches to Avoid Overtraining
Conclusion
Chapter 4. Quantifying Training Stress
Measurement Tools
External Load
Internal Load
Conclusion
Chapter 5. Measures of Fitness and Fatigue
Neuromuscular Fatigue
Heart Rate
Hormonal and Biochemical Markers
Immunological Markers
Performance Tests
Conclusion
Chapter 6. Current Monitoring Practices and Technologies
Monitoring Practices in Sport
Monitoring Technologies
Data from Monitoring Technology
Applications of Monitoring Technology
Conclusion
Chapter 7. Integrating Monitoring With Coaching
Art and Science of Monitoring
Monitoring Data Within a Training Session
Providing Monitoring Feedback to Athletes
Barriers to Effective Athlete Monitoring
Conducting In-House Monitoring Projects
Conclusion
Chapter 8. Athlete Monitoring Guidelines for Individual Sports
Individual Sport Athletes
Monitoring in Individual Sports on a Budget
Monitoring With Training Diaries
Applying Monitoring in Individual Sports
Reporting One Week of Monitoring for an Athlete
Modifying Training Based on Monitoring
Considerations for Monitoring Athletes in Individual Sports
Conclusion
Chapter 9. Athlete Monitoring Guidelines for Team Sports
Team Sport Athletes
Monitoring in Team Sports on a Budget
Applying Monitoring in Team Sports
Monitoring System for Team Sport
Reporting One Week of Monitoring for a Team Sport
Modifying Training Based on Monitoring
Considerations for Monitoring Athletes in Team Sports
Conclusion
Mike McGuigan, PhD, CSCS, is a professor of strength and conditioning at Auckland University of Technology (AUT) in New Zealand and a member of AUT’s Sports Performance Research Institute New Zealand. He is one of the world’s leading scientific researchers on athlete monitoring and is highly regarded internationally for his work on resistance training and strength and power development.
Before working at AUT, McGuigan was at Edith Cowan University and the University of Wisconsin–La Crosse and worked as a sport scientist for High Performance Sport New Zealand. He also has vast experience as an athlete monitoring consultant for elite athletes and coaches, working with high-profile New Zealand sport teams such as the All Blacks and the Silver Ferns.
McGuigan is a strength and conditioning specialist certified by the National Strength and Conditioning Association (NSCA). He received the NSCA’s Outstanding Young Investigator of the Year Award in 2007 and the William J. Kraemer Most Outstanding Sport Scientist Award in 2016. He serves as an associate editor of the Journal of Australian Strength and Conditioning, the Journal of Strength and Conditioning Research, and the International Journal of Sports Physiology and Performance.
Review monitoring results to modify training plans
Figure 8.3 shows a report provided to an athlete and other practitioners. Although electronic and paper formats are popular, practitioners should not be afraid to try alternative approaches to get their messages across.
Reporting One Week of Monitoring for an Athlete
Figure 8.3 shows a report provided to an athlete and other practitioners. Although electronic and paper formats are popular, practitioners should not be afraid to try alternative approaches to get their messages across. A short video or audio clip delivered to the athlete's mobile device may be a good way to relay information and highlight key aspects of the data. Being mindful of the athlete's preferences for how to receive the information is important. A good starting point would be a discussion with the athlete!

Weekly monitoring report for a powerlifter.
A weekly summary should contain all critical information, use an appropriate analysis method, be simple to interpret, and visually capture the key aspects of the monitoring data. Ultimately, the practitioner's goal should be to provide information that will make an impact and guide the programming and planning for the subsequent week.
Practitioners need to be careful not to go overboard with forms for reporting; they should use a format that will actually be used. Reports that are not used but are filed away and never looked at again are pointless. The report should include several important measures that are easily understood along with a brief explanation if needed.
Monitoring reports should provide usable information for the coming week. However, reporting is only one piece of the monitoring puzzle. The process should continue throughout the week to give the practitioner and athlete ongoing feedback so they can make training adjustments and note areas that need attention outside of training.
The results of the week could be presented using a medal system that denotes whether the result exceeded expectations (gold medal), met the required standard (silver medal), or requires attention (bronze medal). Figure 8.3 shows this system for a female powerlifter. Her performance is indicated by estimated 1RMs for the competition exercises (squat, bench press, and deadlift) based on training data; her overall training performance score is the estimated competition total.
Based on the wellness questionnaire, scores are given for the key areas, and a composite score is provided. In addition, training load, monotony, and strain are calculated as a weekly average but also measured relative to a 4-week rolling average. The practitioner could also include a figure that shows the major aspects of the report and the training for the year or training cycle so far. The benchmarking of the ratings (medals or flags or traffic signs) would be up to the practitioner to decide. Performance measures in sports such as powerlifting and weightlifting can simply be benchmarked against performance standards required for competition. Practitioners also need to consider the method of presentation (see chapter 2). Because many athletes may prefer electronic reports, practitioners would need to consider formatting to ensure that their reports appear correctly on mobile devices.
Modifying Training Based on Monitoring
One of the fundamental uses of athlete monitoring in individual sports is to inform adjustments to training prescription (23). Regular monitoring of an athlete's capacities may help optimize adaptations based on force - velocity (strength-speed or power) profiling (24).
Consider a practitioner who decides to use a vertical countermovement and static jump performed on a dual force plate at the start of each week for monitoring two heptathletes. If the practitioner does not have access to a force plate, more cost-effective technologies could be used (e.g., measuring jump height or distance). Monitoring shows that the eccentric utilization ratio (vertical countermovement jump to squat jump ratio) is 1.07 for athlete 1 and 0.93 for athlete 2. This suggests that the training of athlete 2 should include more exercises involving the stretch - shortening cycle (e.g., plyometrics) to improve the athlete's ability to utilize the stretch - shortening cycle. The training could incorporate exercises that focus on increasing the rate of force development using ballistic movements (e.g., jump squats). Depending on the training phase and periodization, the major focus for training should be those qualities requiring improvement. This is where regular monitoring data are particularly valuable. For example, if athlete 2 had low maximal strength in addition to the lower eccentric utilization ratio, the main training focus would be on maximal strength. Based on the monitoring data, athlete 1 might be considered to have an optimal eccentric utilization ratio. However, if these absolute numbers are below the benchmark required for that sport, then the training emphasis should be on improving these even though the ratio seems optimal.
Practitioners need to be wary of simply chasing numbers with training. Instead, they should always consider athlete monitoring data in the overall context of optimizing athlete performance. Consider an athlete who is monitored over a 4-week period. The practitioner records the following results:
Week 1
- Countermovement jump = 55 watts/kg
- Static jump = 55 watts/kg
- Eccentric utilization ratio = countermovement jump ÷ static jump = 55 ÷ 55 = 1.00
The practitioner decides to incorporate more stretch - shortening cycle training that week. Because the relative results are also below the benchmark for that athlete (60 watts/kg), overall capacity still needs to be improved as well.
Week 2
- Countermovement jump = 56 watts/kg
- Static jump = 55 watts/kg
- Eccentric utilization ratio = 1.02
Week 3
- Countermovement jump = 57.5 watts/kg
- Static jump = 56 watts/kg
- Eccentric utilization ratio = 1.03
Week 4
- Countermovement jump = 58.5 watts/kg
- Static jump = 56.5 watts/kg
- Eccentric utilization ratio = 1.04
Each week adjustments are made to the training for that week to ensure continued adaptation. The results show a gradual improvement in both the capacities and the eccentric utilization ratio. However, practitioners should not become overly focused on a particular metric such as the eccentric utilization ratio. They need to also consider the actual numbers and how they fit with the other areas of athletic development.
With regard to unilateral versus bilateral monitoring, dual force plates can reveal any imbalances (see chapter 5); this can be applied across a range of individual sports. Ultimately, the practitioners must decide which variable to measure, such as displacement (jump height), impulse, power, or velocity. If a force plate is not available, the practitioner could use a tape measure or measuring stick to analyze single-leg vertical jumps. Broad or horizontal jump tests are also useful and do not require technology.
For example, a practitioner conducts a monitoring test to measure an athlete's single-leg broad jumps and records the following right leg to left leg ratios:
- Week 1: 1.06
- Week 2: 1.06
- Week 3: 1.08
- Week 4: 1.09
Having a perfect (1.0) right leg to left leg ratio is not a requirement, but a general guideline is that a difference greater than 15% is a red flag for the practitioner (17). Because the ratios in the example are within the 10% cutoff from one week to the next, the practitioner decides not to make any adjustments to the training program. If the ratio changes more than 15%, the practitioner could introduce more single-leg training for the weaker leg. Deciding which ratios are optimal is a challenge because many factors contribute to an imbalance, including sport requirements, limb dominance, and injury history.
However, a comparison should also be made between unilateral and bilateral performance (23). This can indicate a need for more emphasis on single-leg training. Comparing the sum of the right and left legs (e.g., adding the individual impulse scores for each leg in a long jumper) to the scores for bilateral vertical countermovement jump can identify differences in the bilateral deficit (see chapter 5). If one athlete produced 20% more impulse (noted in the sum of the unilateral jumps) and another athlete produced only 5% more, what could this mean to the practitioner? Depending on the sport, this could indicate that the first athlete should focus more on bilateral work in the next week, whereas the second athlete could be doing more unilateral exercises.
Practitioners working with individual sport athletes can often use more sophisticated strength and power monitoring tests than can practitioners dealing with larger numbers of athletes in team sports. For example, load profiling or measuring reactive strength capacity via drop jumps (25) over a range of heights is more challenging with a large squad of team sport athletes than with an individual athlete. Using these monitoring tests across a range of drop jump heights and comparing the results to vertical countermovement jump results can provide useful insights into the athlete's tolerance of stretch load. For example, a practitioner may decide to have an athlete complete a drop jump test using 30 cm (11.8 in.), 45 cm (17.7 in.), and 60 cm (23.6 in.) in addition to the vertical countermovement jump test. Performing these tests will reveal whether the athlete can tolerate the drop jump heights relative to vertical countermovement jump performance. If the athlete produces less jump height with increasing drop height, this suggests a lower tolerance to stretch load. This monitoring data would again need to be put into the context of other monitoring results to help understand the cause of this. It could be a lack of eccentric strength, which may be helped by including more maximal strength training. The lack of reactive strength could also be addressed by incorporating more reactive strength exercises in the next block of training.
Save
Learn more about Monitoring Training and Performance in Athletes.
Learn the steps to create an effective in-house research project
Many practitioners cannot afford to wait for published research to confirm the efficacy of a particular monitoring approach. Being able to design and undertake an in-house research project can be a useful skill.
Conducting In-House Monitoring Projects
Many practitioners cannot afford to wait for published research to confirm the efficacy of a particular monitoring approach. Being able to design and undertake an in-house research project can be a useful skill. An in-house research project is any form of data collection and analysis performed within the sport program to answer a specific question of interest to the practitioner. This could be as simple as determining the reliability of a monitoring tool, or it could be more complicated, such as finding out whether a monitoring tool can determine readiness to train and improve the quality of training sessions.
Without realizing it, practitioners often conduct research on a regular basis when implementing a monitoring system. Of course, the usefulness of this research depends on the quality of the information collected. A retrospective analysis of monitoring data can be particularly useful. This is done by looking back at data collected over a period of time to observe trends and patterns. Sometimes, the decision of which variables to track in athletes becomes clear only after implementing the monitoring system for a period of time. An evidence-based approach can help practitioners make sound decisions about which variables to keep in the system and which to remove.
Both quantitative and qualitative approaches to research can be useful (see chapter 2). Practitioners can use a mixed-methods approach, which includes elements of both. For example, monitoring could include a performance test (quantitative), a wellness questionnaire (quantitative), and a semistructured interview (qualitative). Incorporating several approaches may provide a more holistic view of the monitoring system. Resources for practitioners on how to conduct research projects are available (2, 7, 75).
Asking focused and insightful questions is a critical skill for practitioners, and conducting in-house research projects can be a good way to generate these questions. Having focused questions is a good way to facilitate conversations with other practitioners as well. Practitioners with less experience with data may have a degree of data phobia. Rather than focusing on the numbers themselves, more experienced practitioners can engage in discussions with colleagues about how they are attempting to answer particular problems.
Steps for Completing In-House Research
Following are steps for completing in-house research projects:
- Identify the problem.
- Conduct a search of the scientific literature to see what research has been conducted in the area. PubMed and Google Scholar databases are good starting points for searches.
- Talk to other practitioners and researchers in the area to see whether anyone has completed research on this issue. Other practitioners are a popular source of information (73) and may be able to provide suggestions or feedback on your proposed research.
- Consider using social media to reach out to experts for insights on research.
- Clearly define the research question.
- Develop a brief proposal or outline of what the research project will involve. Rewrite it after getting feedback from other practitioners.
- Identify the logistics of the project, including equipment, personnel, the number of athletes, and costs.
- Do some pilot testing of the methods. This helps to identify issues with the methods and can help to troubleshoot problems that may arise during data collection. Things can be very different when monitoring in the field with a group of athletes!
- Complete the data collection.
- Analyze the data using the methods outlined in chapter 2. It is vital to document all methods of data collection, decisions about data analysis methods, and how analyses were conducted.
- Interpret the findings. What do the results mean? This needs to be put in the context of previous literature, have a theoretical basis, and provide at least one practical application.
- Write a summary of the findings. This should include a bottom-line statement of how the results of this research help the program and athletes. Consider alternative methods for reporting the findings. A short video could be an effective way to summarize the findings for those who spend a great deal of time looking at media content in this format. Would infographics that highlight the key findings of the research be a useful way to report the project summary? Because practitioners do not routinely get their information from published research studies (73), alternative methods for disseminating information are worth considering.
- Research always raises new questions, so be prepared to continue this cycle. Figure 7.3 shows a simplified model to follow when undertaking in-house research projects on athlete monitoring.
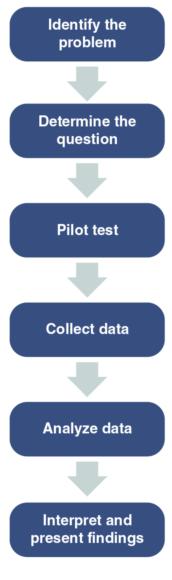
Research process for athlete monitoring.
Consider a practitioner who wants to assess the effectiveness of a simple test for determining training readiness in a group of athletes. She wonders whether a measure of grip dynamometer strength could be a useful indicator of athlete readiness for resistance training sessions. First, she decides to determine the reliability of the test over the course of a 2-week training block. Grip strength measures are performed before and after each training session. A wellness questionnaire is incorporated to provide a subjective measure of the athletes' responses along with session RPE. The reliability of the measures is determined by calculating the coefficient of variation and intraclass correlation coefficient for the test (see chapter 2). A decrease in grip strength from pretraining to posttraining may indicate the effect of the session on force production. Later, measures of grip strength are taken at certain time periods following training sessions. For example, in addition to the pretraining and immediately posttraining periods, the practitioner measures grip strength 6 hr later and then 24 and 48 hr later. She then compares the time course of these measures with other types of training sessions to see whether grip strength is sensitive to fatigue. What would be more difficult would be to investigate how modification of the training sessions affects athletes' performances both acutely and chronically. However, by monitoring the athletes over the course of a mesocycle, patterns may begin to emerge.
A case study - based approach to in-house research projects can be a useful strategy for practitioners (36). For example, a practitioner may collect data from a variety of monitoring tools for a BMX athlete over the course of a training year and throughout a 4-year cycle leading up to the pinnacle event such as the Olympic Games. In year 1 the practitioner could use an experimental approach that involves collecting a large amount of monitoring data. This would be useful for identifying which monitoring tools are reliable, valid, and sensitive to change. Year 1 would also be the time to experiment with interventions to enhance performance, including race day warm-ups and power priming (35). In year 2, the monitoring system could be refined by removing certain tools based on the results from year 1. By the time year 3 comes around, the practitioner would be confident of the monitoring system in place. At this stage only minor tweaks to the system would be required.
Following a research process for determining the validity of equipment can also be useful for practitioners. For example, using different devices to measure the velocity of the bar would allow comparison. Practitioners could attach transducers or encoders to either end of the bar and accelerometry technology to a weight plate. At the same time, the athlete could have some type of wearable device around a wrist or forearm. A similar setup would involve wearing a range of devices for a period of time and comparing the results (40, 66). This way, the practitioner can measure the degree of variability between the devices. Ultimately, making the comparison against a gold standard would be ideal. However, such a standard does not always exist in sport science. For example, a theoretical gold standard for measuring fatigue in athletes would be a maximal-effort sport-specific performance test (78), which is impractical as a daily or weekly monitoring tool.
Save
Learn more about Monitoring Training and Performance in Athletes.
Understand the General Adaptation Syndrome Model
The seminal work of Canadian physiologist Hans Selye, the general adaptation syndrome (GAS) model, forms the basis of many discussions regarding the monitoring of physiological stress. As outlined in chapter 1, the aim of training is to provide a stimulus that improves performance.
The seminal work of Canadian physiologist Hans Selye, the general adaptation syndrome (GAS) model, forms the basis of many discussions regarding the monitoring of physiological stress (100, 101). As outlined in chapter 1, the aim of training is to provide a stimulus that improves performance. Optimizing this relationship requires a solid understanding of the GAS. The model is based on the stages the body, or physiological system, goes through following some type of stimulus. In general, this model proposes that all stressors result in a similar response and that stress can be considered a disruption of the body's homeostatic state.
Figure 3.1 outlines the GAS model. Upon the application of a stimulus or stress, the body enters the shock or alarm phase, which results in training fatigue. Acute fatigue is a normal and expected short-term response to the training stress and an important part of the training process. If adequate recovery follows this initial stress, the second phase, known as the resistance phase, occurs, in which the system returns to baseline, or homeostasis. It is during this return to homeostasis that physiological adaptations are made. This ensures that the training stimulus applied in the future does not disrupt the athlete to the same degree (43). For the third phase, known as supercompensation, to occur, an adequate recovery period must follow the training stimulus. Supercompensation refers to a return to a level that exceeds the baseline, resulting in an increased performance capacity. To ensure optimal training adaptations and benefits, the next training stimulus must be imposed during the supercompensation phase. Insufficient recovery can lead to a final phase characterized by decreased performance and eventually overtraining.
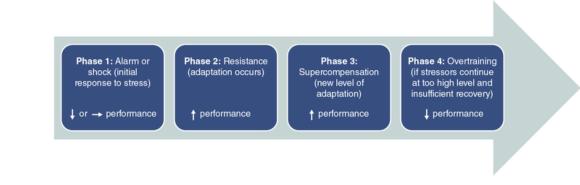
Model of the general adaptation syndrome.
Although the GAS model does not cover all aspects of the response to stress, it is useful for explaining the adaptive response to an acute training stimulus. It is worthwhile noting that the GAS model is not a linear response. All athletes experience fluctuations within days, between days, and across microcycles (generally 7-10 days).
Problems can arise in the GAS when a secondary training stimulus is applied too early. The result can be excessive fatigue, which can lead to training maladaptations. This could eventually result in decreased performance and, in severe cases, negative consequences such as overtraining as depicted by phase 4 in figure 3.1. Alternatively, if no secondary training stimulus is applied during the supercompensation phase, any training adaptations may be lost as the athlete returns to pretraining homeostasis levels.
The delicate balance between overload and underload is extremely important for practitioners to manage. An effective athlete monitoring system can inform the practitioner about the training fatigue and adaptations occurring in athletes. Although the GAS model is a simple representation of how training adaptations occur, it provides a good starting point for understanding the effect of acute training stimuli. The problem with oversimplification, though, is that it can cause practitioners to miss several key aspects in their understanding of athlete monitoring. The reality is that the effect of training dosage on training adaptation is very complex. A wide range of factors and interactions occur during training that make it difficult to analyze the training adaptation response. Practitioners must keep in mind that the impacts of stressors are additive and that other factors can affect the athlete's ability to respond and adapt to the stressors that result from the training (5, 66). Traditional concepts of homeostasis need to take into account the multifactorial nature of athlete training. Specifically, practitioners need to understand how athletes perceive the stress and how their training histories affect how they cope with it.
Save
Learn more about Monitoring Training and Performance in Athletes.
Review monitoring results to modify training plans
Figure 8.3 shows a report provided to an athlete and other practitioners. Although electronic and paper formats are popular, practitioners should not be afraid to try alternative approaches to get their messages across.
Reporting One Week of Monitoring for an Athlete
Figure 8.3 shows a report provided to an athlete and other practitioners. Although electronic and paper formats are popular, practitioners should not be afraid to try alternative approaches to get their messages across. A short video or audio clip delivered to the athlete's mobile device may be a good way to relay information and highlight key aspects of the data. Being mindful of the athlete's preferences for how to receive the information is important. A good starting point would be a discussion with the athlete!
Weekly monitoring report for a powerlifter.
A weekly summary should contain all critical information, use an appropriate analysis method, be simple to interpret, and visually capture the key aspects of the monitoring data. Ultimately, the practitioner's goal should be to provide information that will make an impact and guide the programming and planning for the subsequent week.
Practitioners need to be careful not to go overboard with forms for reporting; they should use a format that will actually be used. Reports that are not used but are filed away and never looked at again are pointless. The report should include several important measures that are easily understood along with a brief explanation if needed.
Monitoring reports should provide usable information for the coming week. However, reporting is only one piece of the monitoring puzzle. The process should continue throughout the week to give the practitioner and athlete ongoing feedback so they can make training adjustments and note areas that need attention outside of training.
The results of the week could be presented using a medal system that denotes whether the result exceeded expectations (gold medal), met the required standard (silver medal), or requires attention (bronze medal). Figure 8.3 shows this system for a female powerlifter. Her performance is indicated by estimated 1RMs for the competition exercises (squat, bench press, and deadlift) based on training data; her overall training performance score is the estimated competition total.
Based on the wellness questionnaire, scores are given for the key areas, and a composite score is provided. In addition, training load, monotony, and strain are calculated as a weekly average but also measured relative to a 4-week rolling average. The practitioner could also include a figure that shows the major aspects of the report and the training for the year or training cycle so far. The benchmarking of the ratings (medals or flags or traffic signs) would be up to the practitioner to decide. Performance measures in sports such as powerlifting and weightlifting can simply be benchmarked against performance standards required for competition. Practitioners also need to consider the method of presentation (see chapter 2). Because many athletes may prefer electronic reports, practitioners would need to consider formatting to ensure that their reports appear correctly on mobile devices.
Modifying Training Based on Monitoring
One of the fundamental uses of athlete monitoring in individual sports is to inform adjustments to training prescription (23). Regular monitoring of an athlete's capacities may help optimize adaptations based on force - velocity (strength-speed or power) profiling (24).
Consider a practitioner who decides to use a vertical countermovement and static jump performed on a dual force plate at the start of each week for monitoring two heptathletes. If the practitioner does not have access to a force plate, more cost-effective technologies could be used (e.g., measuring jump height or distance). Monitoring shows that the eccentric utilization ratio (vertical countermovement jump to squat jump ratio) is 1.07 for athlete 1 and 0.93 for athlete 2. This suggests that the training of athlete 2 should include more exercises involving the stretch - shortening cycle (e.g., plyometrics) to improve the athlete's ability to utilize the stretch - shortening cycle. The training could incorporate exercises that focus on increasing the rate of force development using ballistic movements (e.g., jump squats). Depending on the training phase and periodization, the major focus for training should be those qualities requiring improvement. This is where regular monitoring data are particularly valuable. For example, if athlete 2 had low maximal strength in addition to the lower eccentric utilization ratio, the main training focus would be on maximal strength. Based on the monitoring data, athlete 1 might be considered to have an optimal eccentric utilization ratio. However, if these absolute numbers are below the benchmark required for that sport, then the training emphasis should be on improving these even though the ratio seems optimal.
Practitioners need to be wary of simply chasing numbers with training. Instead, they should always consider athlete monitoring data in the overall context of optimizing athlete performance. Consider an athlete who is monitored over a 4-week period. The practitioner records the following results:
Week 1
- Countermovement jump = 55 watts/kg
- Static jump = 55 watts/kg
- Eccentric utilization ratio = countermovement jump ÷ static jump = 55 ÷ 55 = 1.00
The practitioner decides to incorporate more stretch - shortening cycle training that week. Because the relative results are also below the benchmark for that athlete (60 watts/kg), overall capacity still needs to be improved as well.
Week 2
- Countermovement jump = 56 watts/kg
- Static jump = 55 watts/kg
- Eccentric utilization ratio = 1.02
Week 3
- Countermovement jump = 57.5 watts/kg
- Static jump = 56 watts/kg
- Eccentric utilization ratio = 1.03
Week 4
- Countermovement jump = 58.5 watts/kg
- Static jump = 56.5 watts/kg
- Eccentric utilization ratio = 1.04
Each week adjustments are made to the training for that week to ensure continued adaptation. The results show a gradual improvement in both the capacities and the eccentric utilization ratio. However, practitioners should not become overly focused on a particular metric such as the eccentric utilization ratio. They need to also consider the actual numbers and how they fit with the other areas of athletic development.
With regard to unilateral versus bilateral monitoring, dual force plates can reveal any imbalances (see chapter 5); this can be applied across a range of individual sports. Ultimately, the practitioners must decide which variable to measure, such as displacement (jump height), impulse, power, or velocity. If a force plate is not available, the practitioner could use a tape measure or measuring stick to analyze single-leg vertical jumps. Broad or horizontal jump tests are also useful and do not require technology.
For example, a practitioner conducts a monitoring test to measure an athlete's single-leg broad jumps and records the following right leg to left leg ratios:
- Week 1: 1.06
- Week 2: 1.06
- Week 3: 1.08
- Week 4: 1.09
Having a perfect (1.0) right leg to left leg ratio is not a requirement, but a general guideline is that a difference greater than 15% is a red flag for the practitioner (17). Because the ratios in the example are within the 10% cutoff from one week to the next, the practitioner decides not to make any adjustments to the training program. If the ratio changes more than 15%, the practitioner could introduce more single-leg training for the weaker leg. Deciding which ratios are optimal is a challenge because many factors contribute to an imbalance, including sport requirements, limb dominance, and injury history.
However, a comparison should also be made between unilateral and bilateral performance (23). This can indicate a need for more emphasis on single-leg training. Comparing the sum of the right and left legs (e.g., adding the individual impulse scores for each leg in a long jumper) to the scores for bilateral vertical countermovement jump can identify differences in the bilateral deficit (see chapter 5). If one athlete produced 20% more impulse (noted in the sum of the unilateral jumps) and another athlete produced only 5% more, what could this mean to the practitioner? Depending on the sport, this could indicate that the first athlete should focus more on bilateral work in the next week, whereas the second athlete could be doing more unilateral exercises.
Practitioners working with individual sport athletes can often use more sophisticated strength and power monitoring tests than can practitioners dealing with larger numbers of athletes in team sports. For example, load profiling or measuring reactive strength capacity via drop jumps (25) over a range of heights is more challenging with a large squad of team sport athletes than with an individual athlete. Using these monitoring tests across a range of drop jump heights and comparing the results to vertical countermovement jump results can provide useful insights into the athlete's tolerance of stretch load. For example, a practitioner may decide to have an athlete complete a drop jump test using 30 cm (11.8 in.), 45 cm (17.7 in.), and 60 cm (23.6 in.) in addition to the vertical countermovement jump test. Performing these tests will reveal whether the athlete can tolerate the drop jump heights relative to vertical countermovement jump performance. If the athlete produces less jump height with increasing drop height, this suggests a lower tolerance to stretch load. This monitoring data would again need to be put into the context of other monitoring results to help understand the cause of this. It could be a lack of eccentric strength, which may be helped by including more maximal strength training. The lack of reactive strength could also be addressed by incorporating more reactive strength exercises in the next block of training.
Save
Learn more about Monitoring Training and Performance in Athletes.
Learn the steps to create an effective in-house research project
Many practitioners cannot afford to wait for published research to confirm the efficacy of a particular monitoring approach. Being able to design and undertake an in-house research project can be a useful skill.
Conducting In-House Monitoring Projects
Many practitioners cannot afford to wait for published research to confirm the efficacy of a particular monitoring approach. Being able to design and undertake an in-house research project can be a useful skill. An in-house research project is any form of data collection and analysis performed within the sport program to answer a specific question of interest to the practitioner. This could be as simple as determining the reliability of a monitoring tool, or it could be more complicated, such as finding out whether a monitoring tool can determine readiness to train and improve the quality of training sessions.
Without realizing it, practitioners often conduct research on a regular basis when implementing a monitoring system. Of course, the usefulness of this research depends on the quality of the information collected. A retrospective analysis of monitoring data can be particularly useful. This is done by looking back at data collected over a period of time to observe trends and patterns. Sometimes, the decision of which variables to track in athletes becomes clear only after implementing the monitoring system for a period of time. An evidence-based approach can help practitioners make sound decisions about which variables to keep in the system and which to remove.
Both quantitative and qualitative approaches to research can be useful (see chapter 2). Practitioners can use a mixed-methods approach, which includes elements of both. For example, monitoring could include a performance test (quantitative), a wellness questionnaire (quantitative), and a semistructured interview (qualitative). Incorporating several approaches may provide a more holistic view of the monitoring system. Resources for practitioners on how to conduct research projects are available (2, 7, 75).
Asking focused and insightful questions is a critical skill for practitioners, and conducting in-house research projects can be a good way to generate these questions. Having focused questions is a good way to facilitate conversations with other practitioners as well. Practitioners with less experience with data may have a degree of data phobia. Rather than focusing on the numbers themselves, more experienced practitioners can engage in discussions with colleagues about how they are attempting to answer particular problems.
Steps for Completing In-House Research
Following are steps for completing in-house research projects:
- Identify the problem.
- Conduct a search of the scientific literature to see what research has been conducted in the area. PubMed and Google Scholar databases are good starting points for searches.
- Talk to other practitioners and researchers in the area to see whether anyone has completed research on this issue. Other practitioners are a popular source of information (73) and may be able to provide suggestions or feedback on your proposed research.
- Consider using social media to reach out to experts for insights on research.
- Clearly define the research question.
- Develop a brief proposal or outline of what the research project will involve. Rewrite it after getting feedback from other practitioners.
- Identify the logistics of the project, including equipment, personnel, the number of athletes, and costs.
- Do some pilot testing of the methods. This helps to identify issues with the methods and can help to troubleshoot problems that may arise during data collection. Things can be very different when monitoring in the field with a group of athletes!
- Complete the data collection.
- Analyze the data using the methods outlined in chapter 2. It is vital to document all methods of data collection, decisions about data analysis methods, and how analyses were conducted.
- Interpret the findings. What do the results mean? This needs to be put in the context of previous literature, have a theoretical basis, and provide at least one practical application.
- Write a summary of the findings. This should include a bottom-line statement of how the results of this research help the program and athletes. Consider alternative methods for reporting the findings. A short video could be an effective way to summarize the findings for those who spend a great deal of time looking at media content in this format. Would infographics that highlight the key findings of the research be a useful way to report the project summary? Because practitioners do not routinely get their information from published research studies (73), alternative methods for disseminating information are worth considering.
- Research always raises new questions, so be prepared to continue this cycle. Figure 7.3 shows a simplified model to follow when undertaking in-house research projects on athlete monitoring.
Research process for athlete monitoring.
Consider a practitioner who wants to assess the effectiveness of a simple test for determining training readiness in a group of athletes. She wonders whether a measure of grip dynamometer strength could be a useful indicator of athlete readiness for resistance training sessions. First, she decides to determine the reliability of the test over the course of a 2-week training block. Grip strength measures are performed before and after each training session. A wellness questionnaire is incorporated to provide a subjective measure of the athletes' responses along with session RPE. The reliability of the measures is determined by calculating the coefficient of variation and intraclass correlation coefficient for the test (see chapter 2). A decrease in grip strength from pretraining to posttraining may indicate the effect of the session on force production. Later, measures of grip strength are taken at certain time periods following training sessions. For example, in addition to the pretraining and immediately posttraining periods, the practitioner measures grip strength 6 hr later and then 24 and 48 hr later. She then compares the time course of these measures with other types of training sessions to see whether grip strength is sensitive to fatigue. What would be more difficult would be to investigate how modification of the training sessions affects athletes' performances both acutely and chronically. However, by monitoring the athletes over the course of a mesocycle, patterns may begin to emerge.
A case study - based approach to in-house research projects can be a useful strategy for practitioners (36). For example, a practitioner may collect data from a variety of monitoring tools for a BMX athlete over the course of a training year and throughout a 4-year cycle leading up to the pinnacle event such as the Olympic Games. In year 1 the practitioner could use an experimental approach that involves collecting a large amount of monitoring data. This would be useful for identifying which monitoring tools are reliable, valid, and sensitive to change. Year 1 would also be the time to experiment with interventions to enhance performance, including race day warm-ups and power priming (35). In year 2, the monitoring system could be refined by removing certain tools based on the results from year 1. By the time year 3 comes around, the practitioner would be confident of the monitoring system in place. At this stage only minor tweaks to the system would be required.
Following a research process for determining the validity of equipment can also be useful for practitioners. For example, using different devices to measure the velocity of the bar would allow comparison. Practitioners could attach transducers or encoders to either end of the bar and accelerometry technology to a weight plate. At the same time, the athlete could have some type of wearable device around a wrist or forearm. A similar setup would involve wearing a range of devices for a period of time and comparing the results (40, 66). This way, the practitioner can measure the degree of variability between the devices. Ultimately, making the comparison against a gold standard would be ideal. However, such a standard does not always exist in sport science. For example, a theoretical gold standard for measuring fatigue in athletes would be a maximal-effort sport-specific performance test (78), which is impractical as a daily or weekly monitoring tool.
Save
Learn more about Monitoring Training and Performance in Athletes.
Understand the General Adaptation Syndrome Model
The seminal work of Canadian physiologist Hans Selye, the general adaptation syndrome (GAS) model, forms the basis of many discussions regarding the monitoring of physiological stress. As outlined in chapter 1, the aim of training is to provide a stimulus that improves performance.
The seminal work of Canadian physiologist Hans Selye, the general adaptation syndrome (GAS) model, forms the basis of many discussions regarding the monitoring of physiological stress (100, 101). As outlined in chapter 1, the aim of training is to provide a stimulus that improves performance. Optimizing this relationship requires a solid understanding of the GAS. The model is based on the stages the body, or physiological system, goes through following some type of stimulus. In general, this model proposes that all stressors result in a similar response and that stress can be considered a disruption of the body's homeostatic state.
Figure 3.1 outlines the GAS model. Upon the application of a stimulus or stress, the body enters the shock or alarm phase, which results in training fatigue. Acute fatigue is a normal and expected short-term response to the training stress and an important part of the training process. If adequate recovery follows this initial stress, the second phase, known as the resistance phase, occurs, in which the system returns to baseline, or homeostasis. It is during this return to homeostasis that physiological adaptations are made. This ensures that the training stimulus applied in the future does not disrupt the athlete to the same degree (43). For the third phase, known as supercompensation, to occur, an adequate recovery period must follow the training stimulus. Supercompensation refers to a return to a level that exceeds the baseline, resulting in an increased performance capacity. To ensure optimal training adaptations and benefits, the next training stimulus must be imposed during the supercompensation phase. Insufficient recovery can lead to a final phase characterized by decreased performance and eventually overtraining.
Model of the general adaptation syndrome.
Although the GAS model does not cover all aspects of the response to stress, it is useful for explaining the adaptive response to an acute training stimulus. It is worthwhile noting that the GAS model is not a linear response. All athletes experience fluctuations within days, between days, and across microcycles (generally 7-10 days).
Problems can arise in the GAS when a secondary training stimulus is applied too early. The result can be excessive fatigue, which can lead to training maladaptations. This could eventually result in decreased performance and, in severe cases, negative consequences such as overtraining as depicted by phase 4 in figure 3.1. Alternatively, if no secondary training stimulus is applied during the supercompensation phase, any training adaptations may be lost as the athlete returns to pretraining homeostasis levels.
The delicate balance between overload and underload is extremely important for practitioners to manage. An effective athlete monitoring system can inform the practitioner about the training fatigue and adaptations occurring in athletes. Although the GAS model is a simple representation of how training adaptations occur, it provides a good starting point for understanding the effect of acute training stimuli. The problem with oversimplification, though, is that it can cause practitioners to miss several key aspects in their understanding of athlete monitoring. The reality is that the effect of training dosage on training adaptation is very complex. A wide range of factors and interactions occur during training that make it difficult to analyze the training adaptation response. Practitioners must keep in mind that the impacts of stressors are additive and that other factors can affect the athlete's ability to respond and adapt to the stressors that result from the training (5, 66). Traditional concepts of homeostasis need to take into account the multifactorial nature of athlete training. Specifically, practitioners need to understand how athletes perceive the stress and how their training histories affect how they cope with it.
Save
Learn more about Monitoring Training and Performance in Athletes.
Related Books


